3D Dataloader: PC Loader#
We show here how to use the basic HDF5 pointcloud dataloader that we provide.
from demo_utils_3D import *
import utils3D.plot as plt_utils


ROOT_DIR = "./3D_PC_data/"
Working with stylized pointclouds#
To load pre-sampled pointclouds, we provide the StylizedShapeLoader class. The n_points parameter enables sampling of pointclouds when loading the shapes.
It can be instantiated with the load_mesh parameter toggled to interactively visualize the shapes with a placeholder style.
Meshes fetched by the loader are trimesh.Trimesh instances that contain all relevant geometry information.
"""
Base class for loading preprocessed 3D point clouds.

Args:
----
    root_dir:          Root directory containing HDF5 files.
    split:             One of {train, valid}.
    semantic_level:    Semantic level to use for segmentations. One of {fine, medium, coarse}
    num_points:        Number of points to sample.
    transform:         Data transformations.
    half_precision:    Use half precision floats.
    normalize_points:  Normalize point clouds.
    is_rgb:            The HDF5 to load has RGB features.
"""
from compat3D_PC import StylizedShapeLoader_PC

valid_dataset = StylizedShapeLoader_PC(root_dir=ROOT_DIR,
                                       split="valid",
                                       semantic_level="fine",
                                       num_points=2048,
                                       transform=None,
                                       half_precision=False,
                                       normalize_points=False,
                                       is_rgb=True)

# Iterating over the dataset
for k in range(len(valid_dataset)):
    shape_id, style_id, shape_label, points, points_part_labels, points_mat_labels = valid_dataset[k]
    # Separate points and colors
    points_xyz = points[:, :3]
    points_col = points[:, 3:]

    # Print unique part labels
    print("Unique part labels: ", np.unique(points_part_labels))

    # Print unique material labels
    print("Unique material labels: ", np.unique(points_mat_labels))
    print()

    # Print shape ID
    print("Shape ID: ", shape_id)
    print("Style ID: ", style_id)
    print("Shape label: ", shape_label)

    break
Unique part labels:  [  1   3   8   9  10  11 271 273]
Unique material labels:  [2 6 8]

Shape ID:  00_004
Style ID:  0
Shape label:  0
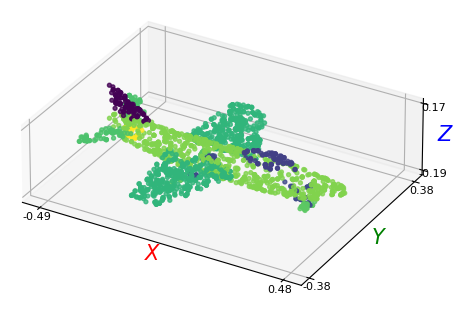
print("Visualizing part labels:")
plt_utils.plot_pointclouds([np.array(points_xyz)],
                            point_labels=[np.array(points_part_labels)],
                            size=15,
                            cmap='viridis',
                            point_size=8)
Visualizing part labels:
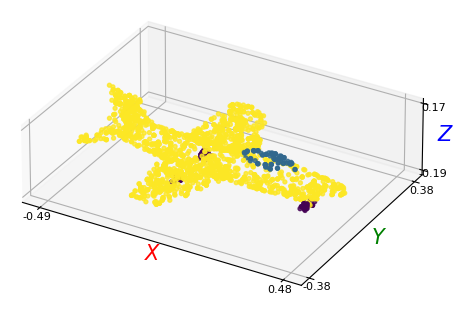
print("Visualizing material labels:")
plt_utils.plot_pointclouds([np.array(points_xyz)],
                            point_labels=[np.array(points_mat_labels)],
                            size=15,
                            cmap='viridis',
                            point_size=8)
Visualizing material labels:
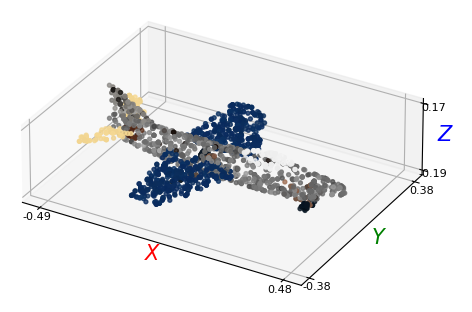
print("Visualizing RGB pointclouds:")
plt_utils.plot_pointclouds([np.array(points_xyz)],
                            colors=[np.array(points_col)],
                            size=15,
                            cmap='viridis',
                            point_size=8)
Visualizing RGB pointclouds:
Hint
In this first release, we only provide pre-extracted pointclouds for the first 10 compositions of our dataset.
There is thus no n_compositions option modulating for the number of loaded styles per model.
If you want to explore more compositions, please refer to our documentation on sampling your own dataset.
Fetching a stylized shape#
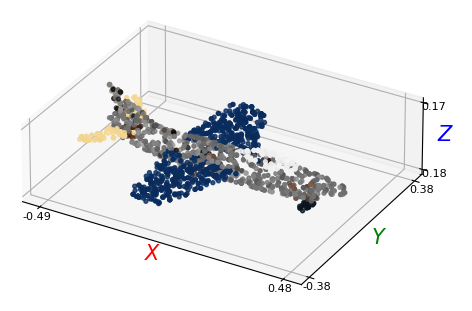
We enable directly fetching a stylized shape’s pointcloud from the dataloader by using its shape_id and style_id, to enable better compatibility with the 2D streamed loader.
We illustrate this in the example below:
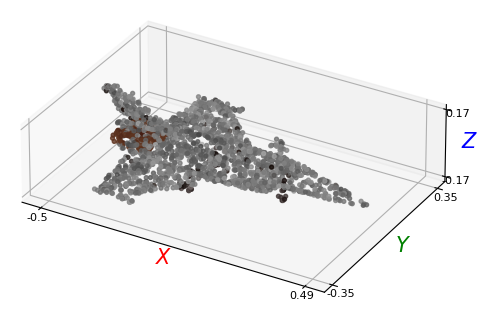
# Recovering the stylized airplane above
_, _, _, points, _, _ = valid_dataset.get_stylized_shape("00_004", "0")
points_xyz = points[:, :3]
points_col = points[:, 3:]
plt_utils.plot_pointclouds([np.array(points_xyz)],
                            colors=[np.array(points_col)],
                            size=15,
                            cmap='viridis',
                            point_size=8)
Evaluation dataloader#
Hint
The section below is not relevant, as we have now released the test set labels, as our CVPR 2023 challenge is over.
You can access the test data loader just as any other split, using the split="test" parameter.
For more information, please take a look at the documentation on the 2D dataloaders.
The test HDF5 files that we provide are stripped of all ground truth data. They only contain:
a)the sampled pointcloudb)the stylized shape identifiers (shape_id,style_id)
To iterate over the test dataloader, you need a special dataloader, EvalLoader_PC, which only fetches these fields form the data shards.
We illustrate below its usage:
"""
Base class for loading preprocessed 3D point clouds.

Args:
----
    ...:    See CompatLoader3D.
"""
from compat3D_PC import EvalLoader_PC

test_dataset = EvalLoader_PC(root_dir=ROOT_DIR,
                             semantic_level="coarse",
                             num_points=2048)

# Iterating over the dataset
for k in range(len(test_dataset)):
    shape_id, style_id, points = test_dataset[k]
    # Separate points and colors
    points_xyz = points[:, :3]
    points_col = points[:, 3:]

    # Print shape ID
    print("Shape ID: ", shape_id)
    print("Style ID: ", style_id)
    break

plt_utils.plot_pointclouds([np.array(points_xyz)],
                            colors=[np.array(points_col)],
                            size=15,
                            cmap='viridis',
                            point_size=8)
Shape ID:  00_000
Style ID:  0
